Understanding Data Analytics to Develop a Strategy
Are you interested in optimizing data usage to help your company grow? Discover how a data analytics strategy can do just that in this guide.
The utilization of relevant and accurate data plays a pivotal role in the success of any company. By drawing on thousands of statistical analyses, an industry leader can learn, adapt, overcome, and – perhaps most importantly of all – continue to grow.
To do that effectively, a comprehensive data analytics strategy needs to be created and adopted en masse across a corporation. In this guide, we’ll discuss exactly how to understand every aspect of data analytics, the different types of approaches you can take, why it’s important for your enterprise, how to avoid the threat of poor quality data, and how to craft a strategy that works for you.
What is data analytics?
In order to optimize your approach to data processing, it’s important to understand exactly what data analytics is as a concept. In short, data analytics is a technique used to assess raw sets of data, which in turn allows you to make measured and accurate decisions
Any kind of data can be analyzed to provide further insight. The process calls on trends and key metrics which might otherwise be lost when trying to absorb a large chunk of unprocessed information. The end goal is to optimize your processes wherever possible, heightening efficiency and helping your organization grow on a national or global level.
By implementing data analytics into a business model, a company can mitigate risk, detect threats such as fraud and financial crime, negate a potential loss of profits, cut overhead costs, identify opportunities, optimize workflow processes, or even drive up customer satisfaction rates.
Types of data analytics
There’s no one-size-fits-all approach to the processing and analysis of raw data. Each individual scenario will require a different method, depending on the size, nature, and accuracy of the data to hand – as well as what your desired end result is. Here are some of the most common ways that data analytics can be executed:

Descriptive analytics
This form of data assessment provides insight into where key metrics are sitting. They describe what changes have occurred over a period of time – for example, providing insight into how different branches or global offices might be performing.
Diagnostic analytics
This type of analysis places more focus on why something might have happened, rather than just what the outcome is. More diverse data is assessed when running a diagnostic, as well as the need to occasionally hypothesize. It’s a useful tool to turn to when unexpected results happen, regardless of whether they’re positive or not.

Predictive analytics
One of the key ways to stay ahead of the game is to utilize predictive analytics. This subset of the analysis family allows you to assess past behavioral patterns to better understand what the future might look like. This can be hugely influential on the overall success of seasonal campaigns.
Prescriptive analytics
Data is never stationary, and your business shouldn’t be either. This form of analytics looks at what’s happening in the moment, to assess whether changes need to be made to existing processes to garner better results. Spotting these opportunities as they present themselves can be the difference between a profit or a loss.
At least one of these four approaches to data analytics will be applicable to almost every situation where you want to collect and measure information about your business.
Why is data analytics important?
Data analytics can play a large role in the overall success of your enterprise. There are a host of ways in which having accurate, correctly processed data will serve to benefit your company. Here are some of the most important reasons why you should strongly consider optimizing your data analytics approach:
Informed decisions. Having a thorough and detailed statistical breakdown of core datasets will allow you to feel confident in all aspects of the decision-making process. Knowing that your choices are supported by data-backed evidence provides valuable peace of mind.
Clearly defined metrics and KPIs. Having accurate data means you can set achievable company goals. This helps steer a business at a reasonable pace and in the right direction. Setting unrealistic targets can be damaging to growth, as it gives a misrepresentative view of where a business is or might be headed.
Forecasting accuracy. Part of that growth is having a solid understanding of what the future might look like. To avoid generating excess overheads, or increasing your workforce beyond your necessary requirements, you must understand the true direction your business is headed in. While this can never be done with complete certainty, the more accurate the data, the more likely your forecasts will be reflective of your genuine growth.
Learning from the past. Sometimes things don’t go to plan for a business. While the root of a problem can sometimes be obvious, there are also occasions where further analysis might be required to uncover where something might not have worked out as expected. Identifying these issues helps you learn from your mistakes, and, importantly, not repeat them.
Teams working on different pages. Without a clearly defined landscape, different teams or departments within your organization might find themselves operating under varying beliefs about where a campaign is, what the next best course of action is, or what elements of a project need to be changed. By utilizing data analytics – which provides a clear and concise representation of where your business truly is – everyone can work off the same understanding. This cohesion across the company can prove invaluable and help avoid costly mistakes.
What are some of the different data analytics techniques?

An organization’s approach to data analytics should be fluid, adaptable, and thorough. As such, it’s pertinent to assess every avenue of analysis possible. Understanding the different data analytics techniques available will optimize growth opportunities – giving detailed insight into which strategies might prove most effective.

Regression analysis
Most useful for making predictions and forecasting future trends, regression analysis works by helping a company assess if independent variables (factors that already exist within your organization) impact dependent variables (the outcome that is intended to be measured). For example, marketing spending might be assessed alongside new account openings at a bank to assess if further funds need to be siphoned into this stream, or taken away and utilized elsewhere.

Data mining
This process sees an enterprise look for patterns or anomalies in large subsets of data to help identify opportunities for growth, increased revenue, or even customer relations and retention. It relies on a series of algorithms and machine learning to highlight consistencies and inconsistencies within data, helping to craft a more accurate image of important company factors. A good example would be an insurance company using data mining to provide accurate and competitive premiums for customers.
Cluster analysis
As the name suggests, cluster analysis allows an organization to group relevant, independent subsets of data, to allow for a more pointed and targeted approach. This can help to centralize key strands of data, which in turn provide more succinct and usable information for several core business metrics. Marketing firms might cluster particular demographics of people, while geologists will even use this form of statistical analysis to predict earthquakes.

Natural language processing (NLP)
This subfield of AI learning is being increasingly used by less technically savvy members of organizations to help them manage data more effectively. NLP makes it easier for an employee to interact and react to both static and fluid data – which in turn makes it easier for multiple people in a business or branch to have an actionable impact on marketing or sales strategies.
Factor analysis
If you have a large subset of data that you aren’t sure how to best utilize, you can use a factorial analysis approach. This helps condense large subsets of data into more bitesize chunks, allowing you to draw on hidden patterns and find correlating data that can be used to your advantage. If you have surveys with tens of thousands of responses, this can be used to group and assess customers on a more finite basis.
Sentiment analysis
When large swathes of textual data exist, it can be hard to quickly pull out what you need. Sentiment analysis works to identify the true value of qualitative data, making it easier for organizations to get immediately to the crux of what this subset of data might be telling them. This can be achieved in one of three ways:
Fine-grained sentiment analysis – which places focus on polarity (positive, negative, or neutral results), such as customer reviews and retention rates.
Emotion detection – which uses NLP and machine learning to pull out complex emotional language detection from large chunks of text. These can then be categorized according to the needs of your organization.
Aspect-based sentiment analysis – which allows you to hone in on the specifics of your data. For example, if people find a campaign’s promotion to be annoying, responses of this nature will be grouped together.
At its core, sentiment analysis allows an enterprise to quickly identify how thousands, or even millions, of customers or clients are really feeling.
Gain control of your data

How to create a data analytics strategy
Now that you’ve got a clearer understanding of what data analytics is and how it could impact your enterprise, it’s important to understand how to best create and execute a strategy that gets the most out of data processing.
While the process might look different on a case-by-case basis, there are similar processes that any successful data analytics strategy needs to follow to be successful. Here are some of the most important steps for setting yours up:
1. Align it with your business strategy
For your analytics campaign to have the impact you need it to, you’ll want to tie it as closely as possible to wider company goals. Your goal should be to create a business strategy that is infused with data and analytics, not a data strategy or analytics strategy.
When a data analytics strategy serves to support your company targets, you’ll focus attention, time, money, and resources on the right parts of your organization.
Some of the best ways to make sure you’re aligning your data and strategy goals are to:
Identify key drivers of your core business that could be positively impacted by a data initiative
Talk to the heads of every branch or office to fully understand what they’re trying to achieve, as well as what their day-to-day role looks like
Have a clear understanding of the measurable metrics which each department of your enterprise is operating under
Look at where your company sits in comparison to the industry standard, and try to decipher where having greater data insight could help you improve
Once you have a clearer picture of the above, you’ll be able to work out where and how your data analytics can tie into larger company goals.
2. Evaluate your data analytics maturity level
Not every business is equally positioned to undertake a comprehensive data analytics campaign at the drop of a hat. To understand what valuable information you’ll be able to draw from a campaign, you’ll first need to work out the current capabilities of your strategy – also referred to as its maturity level.
You can do this by auditing a series of key elements that will make up your wider strategy, such as:
Tools and technologies you have at your disposal
The current data storage and gathering systems you have in place
Your existing data infrastructure and architecture
The people you have in your company who can manage and process a data analytics strategy
Once you have more of a grounding in regards to your maturity levels, you’ll be able to prioritize what goals and metrics you can measure accurately. This prevents your campaign from failing before it can even get off the ground.
3. Choose the technology you’ll use
Next, you’ll want to hone in on what technology you’ll rely on to carry out the project. This could mean turning to something totally new, or assessing whether your existing tech is able to support your larger goals.
When thinking about what to use, keep the following core principles in mind:

Relevance – is the technology being used going to provide you with results which will actually help your targets?

Accessibility – the data that is being processed needs to be easily attainable and absorbable for the people who need access to it.
Performance –does the technology provide the level of output required? It’s vital that you get quick, relevant results from the tech you’re positioning your goals around.
Also be sure to make sure you have technology which will be effective at every stage of the data analytics lifecycle. That means:
Extraction
Storage
Integration
Cleansing
Validation
Presentation
It might be smart to assess the relevance, accessibility, and performance of your tech at each of these individual stages, rather than taking a more generalized overlook. This helps you hone in on exactly what may or may not need upgrading.
4. Picking your data analytics team
Arguably the most important aspect of any project is making sure you have the right people in the right positions. In order to effectively achieve this, you’ll need to decide on the type of operating model you’ll be using for the project:

Decentralized model – This method sees the wider company tackle a strategy, rather than just a specified department like IT.
Centralized model – This model uses more executive governance to see one person, team, or department oversee the project in every office.
Hybrid model – In this instance, a centralized authority might be present but with contributions from the whole enterprise.
5. Ensure data governance
In order for your data to be as effective as possible, you’ll need to ensure it’s high-quality, accurate, and relevant. In essence, this means setting internal data policies to guarantee that the gathering, storing, processing, and disposal of data is done accurately and securely.
If you’re worried about how bad data could impact your data analytics strategy, jump to our section on the impact of poor quality data.
6. Create a full roadmap
Once you have everything laid out, it’s time to take a look at creating a roadmap. This is where you can bring the previous five steps together, as you set your core targets, decide on the metrics you’re going to use as assessment tools, hand out roles and responsibilities, and ultimately lay out a timeline for the entire strategy.
Important factors which you’ll need to consider at this stage include things like:
How much financial investment will be needed at every stage of the process
What company milestone you have, and when these ideally need to be hit
Other existing enterprise-wide projects which might suffer, or that might draw resources away from your new data analytics strategy
Staff capability and availability
Assess each of these core aspects, then begin to piece together what the next few months, or even years, might look like for your strategy.
7. Make sure your wider team adopts the new approach
None of the hard work which you’ve put in is going to amount to anything if your team doesn't buy into it. This might not even be because they aren’t convinced – it could just be that the change in responsibilities and expectations leaves them feeling a bit lost.
Some top level actions which you can take are things like:

Training. Make sure to provide the opportunity to heighten skills and further develop an understanding of how an employee can get the most out of your new approach to data.
Budget. Spare budget needs to be allocated to different sections of the strategy, in the event that unforeseen circumstances require more financial investment.

Communication. All major changes, as well as the overall roadmap, need to be shared and openly discussed with all involved. This transparency gives everyone a chance to ask questions, as well as clearly understand where their place in the bigger picture lies.
The more you do to show your team they’re supported, the easier they’ll find it to adapt to a new way of working.
Data Analytics Tools
Several tools exist to streamline the data analytics process for corporations. These range from those created with the express intent of serving this purpose, to common online tools which can be used to leverage data analytic performance.
Spark. Crafted specifically with data analytics in mind, this unified big engine data processing system has an open interface that makes it easy to use in conjunction with existing technologies at your company. One of the leading programs for large-scale SQL, batch processing, stream processing, and machine learning, Spark is able to rapidly process data across multiple computers at one time.
Tableau. Visually appealing and easily digestible results are one of the core benefits of using Tableau to aid in data analytics – but far from the only one. You can host the program internally, or on the Tableau Online system. Scalable and efficient, this engine also relies on Einstein Discovery AI to make integration with your existing systems seamless.
Excel. This Microsoft tool is used by millions across the world – from CEOs to school kids. Their “Analyze Data” feature continues to be one of the most responsive and transparent tools to integrate into your data analytics approach. Excel provides suggestions based on your existing data, as well as data summary, question and answer prompts, ranking and trend analysis, and even outlier accentuation.
Python. Python coding can be used for handling missing values, formatting, normalizing, and binning data. Utilizing libraries such as Panda, Scipy, and Numpy, Python is able to apply analytical techniques to quickly pull out key metrics. The system is ideal for regression models, prediction, and decision-making purposes.
The impact of poor quality data on your strategy

As with any data analytics strategy, misleading information can cause big problems. Having inaccuracy in the information which you’re using to make big decisions could leave you in a bind. Just some of the ways that bad data can impact you include:
Inaccuracy. First and foremost, having poor data to draw on will ultimately mean the conclusions any analytics campaign draws on are inaccurate. This misrepresentation of reality could result in you making decisions or taking actions which are detrimental to wider company goals.
Missed opportunities. If you’ve carried out a predictive analytics campaign, you might find that bad data means you miss out on key market trends, customer insight, or product improvements.
Wasted time. At its core, an analytics campaign strives to save you time – running over vast amounts of data in significantly quicker time than any human can do manually. However, if your strategy draws on poor or misleading data, it still represents a large amount of time that was dedicated to a fruitless project.
Low morale and employee retention. It can be frustrating to spend days working on projects, only to find the data you relied on was flawed from the outset. For members of sales or marketing teams who find themselves in this position, it’s only natural for their morale to take a hit. Faith in leadership might be damaged, which in turn results in them turning their attentions to opportunities elsewhere.
Thankfully, there are steps that can be taken to ensure your data remains accurate and useful. Some of the most relevant ways to stay ahead of bad data are:
Audit and clean data. By keeping on top of all the data you have at your disposal, you ensure it refrains from becoming stagnant or decayed. In order to do this you might want to carry out a data audit, which will involve profiling the data and assessing how it might have an impact on your business if it’s found to be poor.
Make sure everyone adopts quality data storage and gathering. Having standardized guidelines and procedures for how you gather and store data guarantees it will be formatted correctly, and avoids duplication. This universal approach needs to be understood and actioned by your whole corporation in order to ensure that the correct actions are taken when handling any raw data.
Use the ACCUT method. When working with data it’s important to maximize efficiency wherever possible. By using the acronym “ACCUT”, everyones can make sure they’re following the appropriate principles for doing just that. This means:
Accuracy – perhaps most important of all, you need to make sure that all data you have at your disposal is accurate. This can be anything as serious as your organization’s end-of-year profits, to simply the correct spelling of a customer’s name in your databases.

Completeness – all data needs to be fully catalogued and stored, with no gaps or empty spaces on tabs, columns, or cells.

Consistency – if there’s a difference between what should be the same copies of datasets, make sure to identify the correct one and delete the incorrect data.

Uniqueness – duplicate copies can also lead to misleading results. Make sure all data that’s been collected is unique.

Timeliness – most data will only stay relevant and useful for a certain period. Have notifications in place to serve as alerts for when data passes a certain age. It might be possible to delete it at this point.
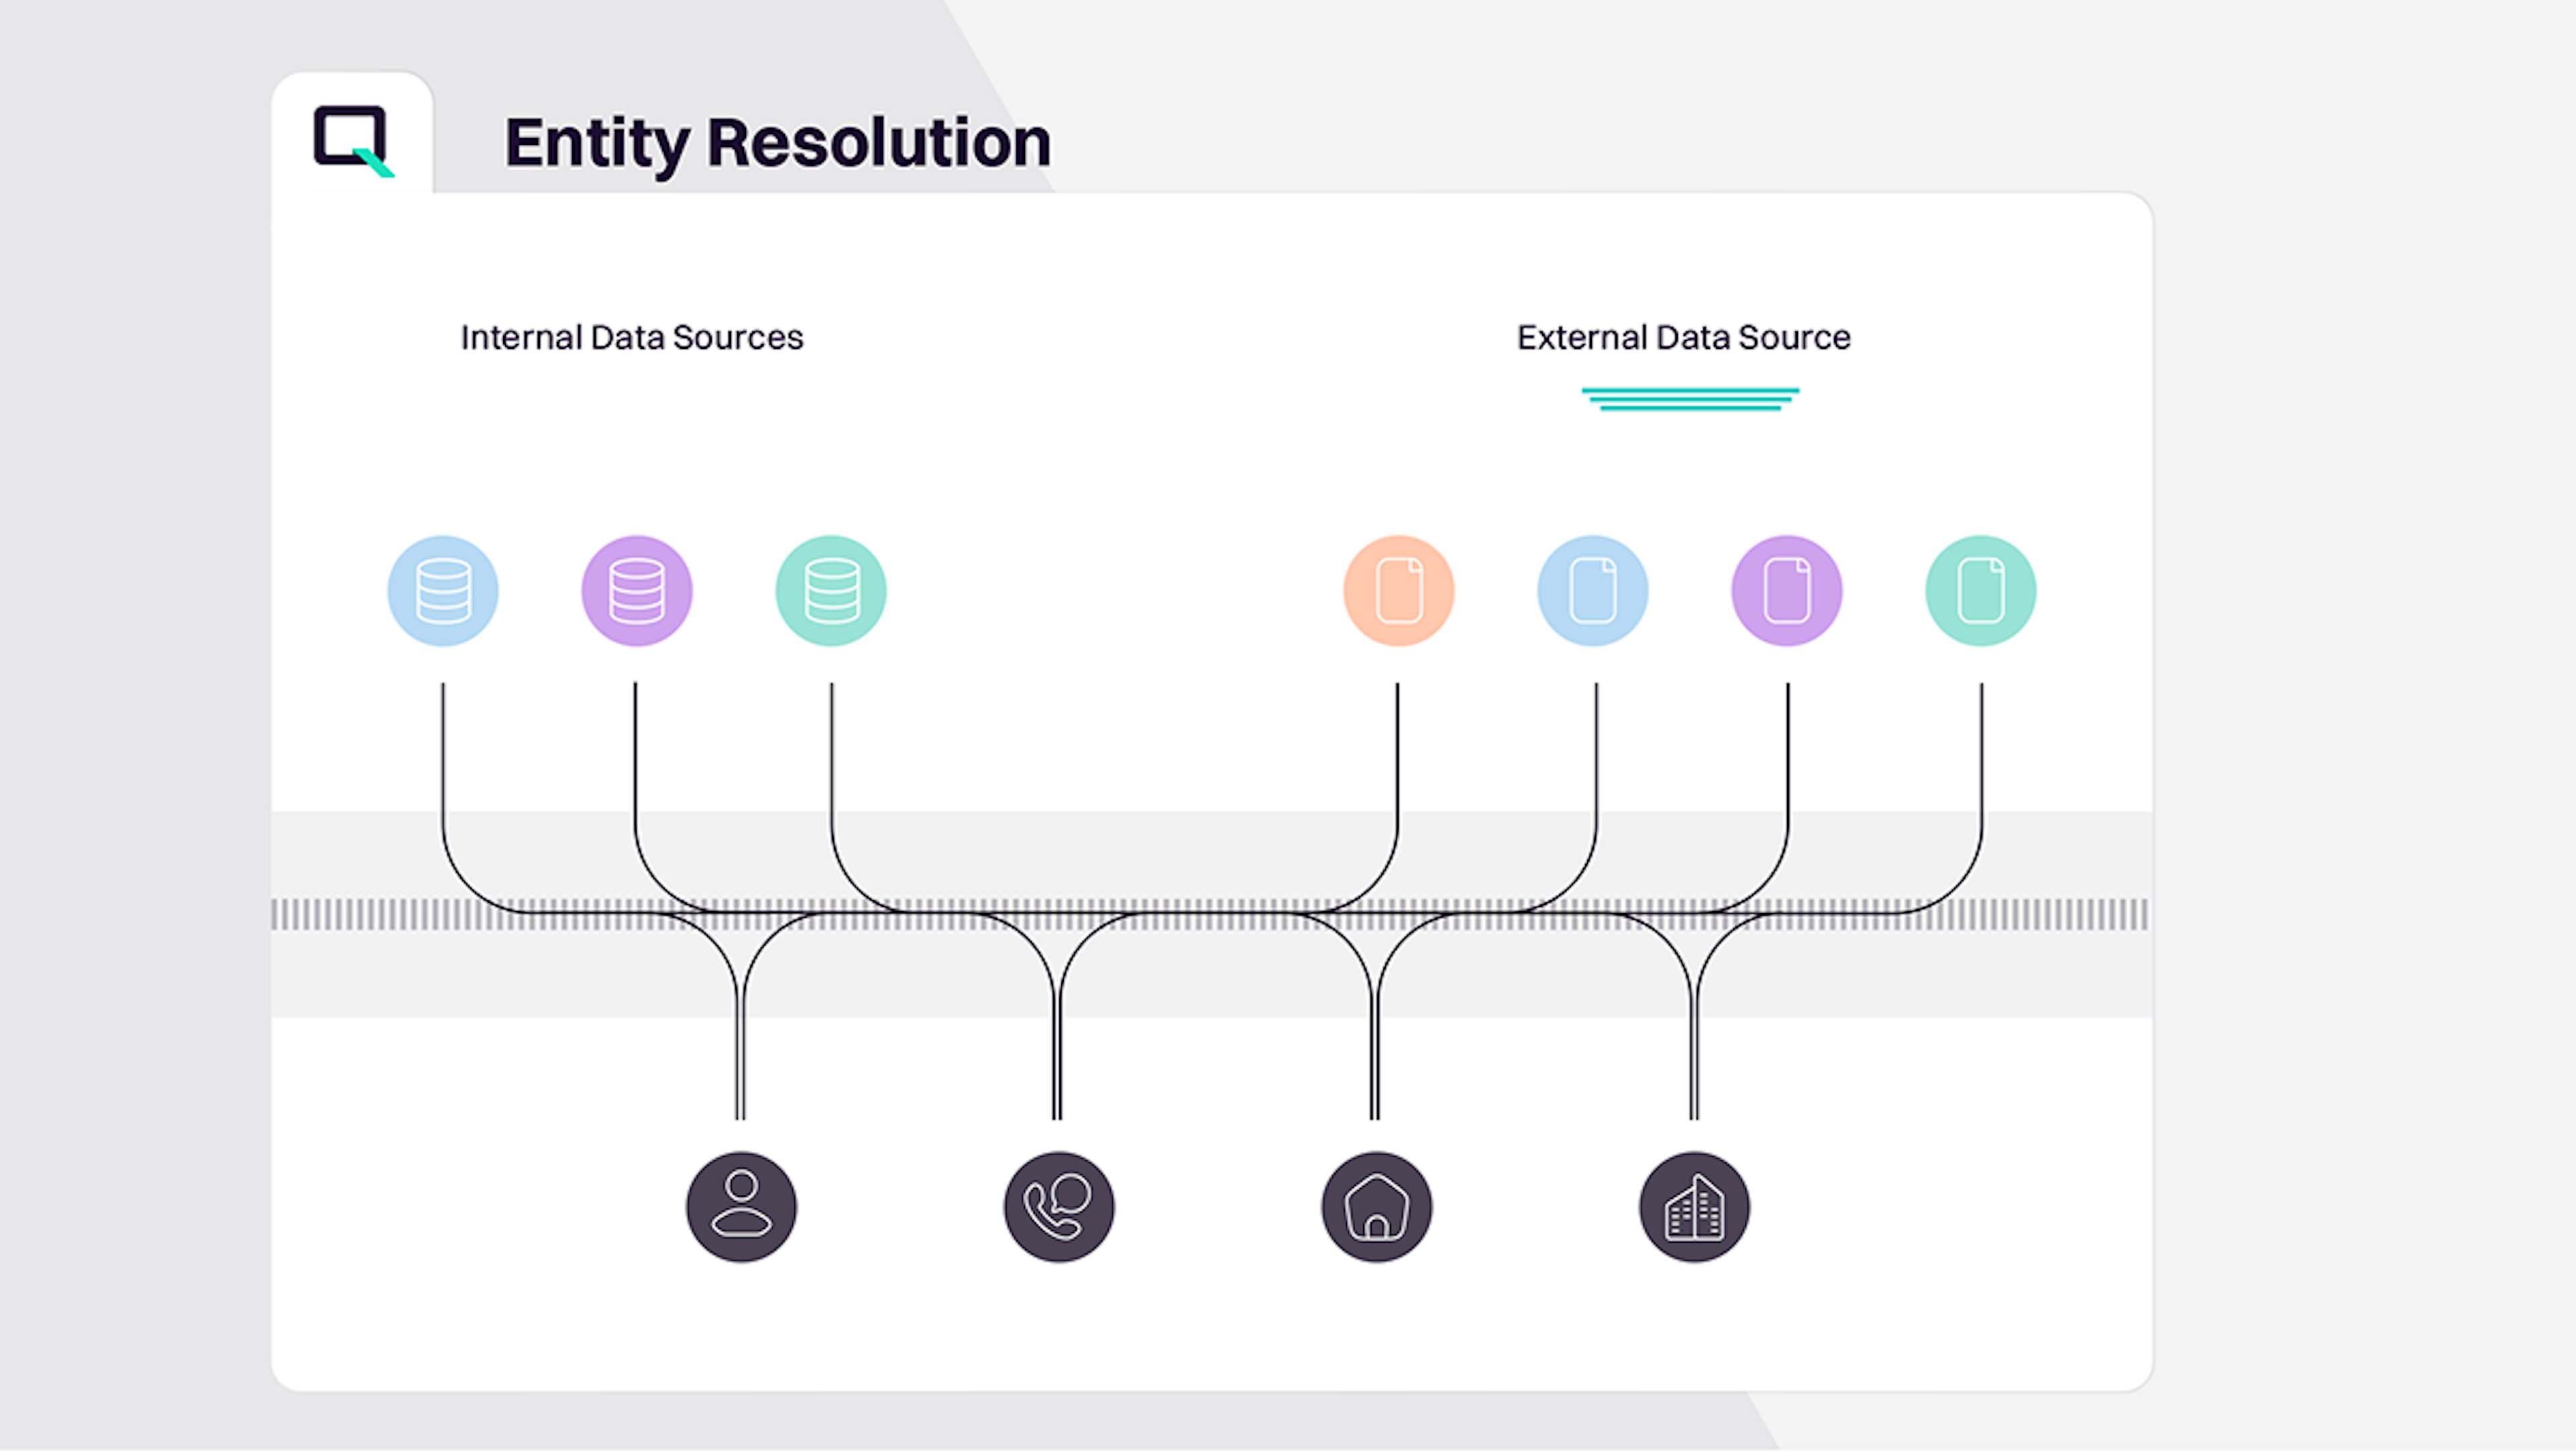
How entity resolution improves data quality